one-chat is a WebRTC app with 1:1 video calls, whose call-setup path ran through a single Node process with call state in memory. I wanted to know how far that could go, so I load-tested it.
What I found wasn’t a bug. It’s just what a single process running everything adds up to: one event loop, one thread, and all the call state sitting in memory.
So I rebuilt that layer around an explicit state machine (explicit because the old code didn’t really have one, more on that below), backed it with a session store that isn’t tied to any particular process (the piece that later makes Redis a drop-in swap, not a rewrite), then ran the whole thing across several backend instances behind a load balancer, to see whether it held up.
Single instance: ~300–350 concurrent call setups (the offer→answer signaling handshake) before p95 (95th percentile) offer→answer crosses a 500 ms threshold. Past that it degrades gracefully: no errors, no dropped calls, no leak, all the way to 1000. The failure mode is being slow, not broken.
The bottleneck is event-loop saturation, not CPU (~1.6 of 8 cores), not the relay code (sub-millisecond), not mainly the database. A bigger single-instance machine doesn’t help: extra cores sit idle unless a second process exists to use them, which is what running multiple instances fixes.
After the rewrite, Redis, and multiple instances, the concurrency ceiling scales near-linearly: ~410 setups on 1 instance, ~670 on 2, ~990 on 3 (about 80% per-instance efficiency), until the shared MongoDB becomes the next wall (offer-path query latency up 60% from 1 instance to 4).
The signaling path and the latency target
1:1 video calls run over peer-to-peer WebRTC. The two browsers can’t reach each other directly, so they first exchange connection info through the server: an SDP offer/answer (codecs, encryption) and a trickle of ICE candidates (possible network paths). The Node + Socket.IO backend relays each of those messages and holds the state for the call.
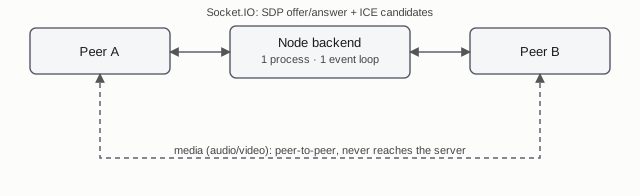
Once signaling completes, media flows between the browsers, and the server never sees it. What scales with call volume on the backend is signaling: a burst of 20 to 40 small messages per call setup (the SDP offer and answer, then a trickle of ICE candidates as each side discovers network paths), then near silence. Group calls go through a Jitsi SFU instead, and aren’t covered here.
For 1:1 calls, the backend owns the whole signaling path, so any limit lives in that code.
Capacity is measured against a latency target. WebRTC call setup should
feel instant; 500 ms p95 offer→answer (p95 meaning 19 of 20 setups finish
faster) is the line. The point where p95 crosses that line is the capacity
ceiling. “Offer→answer” is the round trip the caller sees: call-offer goes
out, the server relays it, the callee answers, and the server relays that
answer back.
Single-instance baseline
Instrumentation
The numbers below come from OpenTelemetry (OTEL_ENABLED=true), split into a
safe-to-import API and a separate SDK that does the actual collecting. Call
the API before the SDK starts and it silently does nothing. That is what
happened here: the signaling metrics module grabbed its handle at import
time, before the SDK had registered, so every custom metric it recorded went
nowhere, with no error or warning. The fix: fetch the handle lazily, on first
use, instead of at import:
let instruments;

function i() {
	if (instruments) return instruments;
	const meter = metrics.getMeter("one-chat-signaling");
	instruments = {/* counters, histograms, gauges */};
	return instruments;
}
By the time anything actually calls i(), the SDK bootstrap has already
registered itself; it runs at the import in server.js.
Five custom metrics back the findings in this post:
| Metric | Captured at | What it isolates |
|---|---|---|
signaling.offer_answer.duration | t0 (call-offer sent) → answer received | the whole benchmark number |
signaling.db.query.duration | wraps Conversation.findOne() during offer handling | Mongo cost, separated from handler cost |
signaling.ice.relay.duration | per ICE candidate, after the call connects | shows the relay code isn’t the bottleneck |
signaling.sessions.size | continuous background gauge | memory-leak check: drains to 0 after teardown |
nodejs_eventloop_utilization | continuous, process-wide | not tied to any single message |
Metrics leave the process through a Prometheus HTTP endpoint
(:9464/metrics) that the load-test driver scrapes at each concurrency level.
Load driver
The load is generated by a custom script written for this test: a Node/Socket.IO client (the “driver”) that plays both sides of N simulated calls. Each concurrency level runs in two phases: connect all N call pairs, wait for everyone to be ready, then send all N offers at the same instant. That way “concurrency N” really means N calls being set up simultaneously, not the Nth call arriving while the rest sit idle. The driver also tracks its own event-loop lag, so a level where the measuring tool falls behind gets flagged instead of trusted. The offer→answer number is a timestamp around the exchange:
async function exchangeOffer(s, metrics) {
	const [awaiting, answered] = [
		s.ans.waitFor("call-offer"),
		s.off.waitFor("call-answer"),
	];
	const t0 = Date.now();
	s.off.emit("call-offer", {
		offer: CANNED_OFFER,
		conversationId: s.row.conversationId,
	});
	await awaiting;
	s.ans.emit("call-answer", {
		conversationId: s.row.conversationId,
		answer: CANNED_ANSWER,
	});
	await answered;
	metrics.offerAnswer.push(Date.now() - t0); // this is the number in the table below
}
t0 starts the clock just before the offerer emits; the clock stops once the
offerer gets the callee’s answer back. That’s the same round trip a
real caller waits through.
Results
| concurrent 1:1 setups | p95 offer→answer | event-loop util (mean) | CPU (cores) | errors |
|---|---|---|---|---|
| 50 | 106 ms | 0.64 | 2.3* | 0 |
| 150 | 213 ms | 0.74 | 1.6 | 0 |
| 250 | 355 ms | 0.83 | 1.6 | 0 |
| 300 | 417 ms | 0.85 | 1.6 | 0 |
| 400 | 563 ms | 0.86 | 1.6 | 0 |
* The 50-level reading (2.3 cores) is warm-up: the JIT compiler and garbage collector do extra work while the process settles. From 150 up, CPU holds flat at ~1.6 cores, the real “not CPU-bound” evidence.
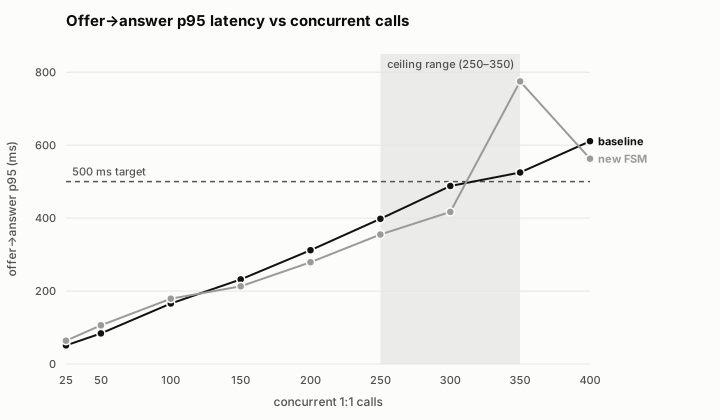
The ceiling lands around 300–350 concurrent setups, and the climb to it is gradual: latency rises steadily, with no level where it suddenly blows up. Zero errors anywhere. Pushed all the way to 1000 concurrent, it’s still zero errors, just a 1.7 s p95. Unusable, but every call still completes.
Why the event loop is the bottleneck
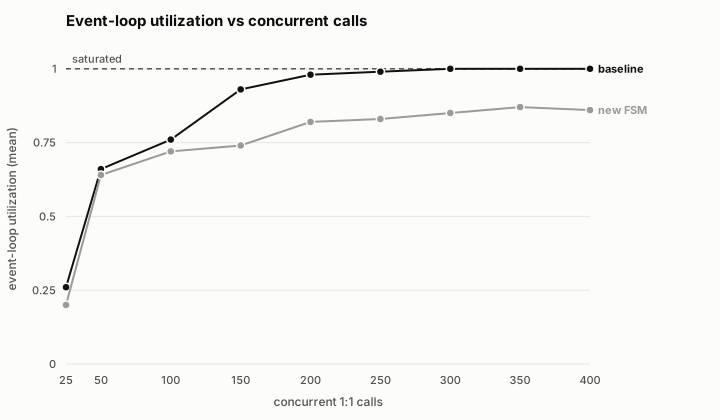
Event-loop utilization climbs steadily from 0.26 to 1.00 as concurrency rises, tracking latency closely: same shape, same bends in the curve. By ~150 concurrent, the Node thread already averages over 90% busy; past 300 it’s pinned, and every message queues behind whatever’s already in flight.
Three things could be the bottleneck; two aren’t it. CPU stays at ~1.5–1.8
cores the entire ramp, in a machine with many more cores than that, so it isn’t
CPU. The relay code stays sub-millisecond throughout, so the old linear peer
lookup is invisible at this scale. What’s actually saturated is the single
event-loop thread: the machine has spare capacity sitting idle, but a single
thread can’t reach it, so a bigger box wouldn’t move the ceiling. The database adds a
smaller effect besides: the offer path’s Conversation.findOne().populate()
call, which checks that this user belongs to the conversation, goes from
~30–40 ms idle to ~155 ms at 400 concurrent, since a local mongod competes with
the driver and backend for the same host. That drags out the slowest setups,
but isn’t the wall: zero out the query time entirely and the loop is still
saturated just from the volume of messages.
There’s no leak either. Holding 300 established calls for 240 s: process memory holds flat around 179 MB, the heap cycles up and down as usual instead of climbing, and it drops back to 172 MB within 15 s of teardown. Session-map entries drain to zero at every level.
Put together, this is an architecture limit, not a tuning problem: a single-threaded process is carrying every signaling message and every DB call, and no setting changes that shape. The only real fix is more instances, and that means getting session state out of the process. The rest of this post does exactly that.
Rewriting around a state machine
One shared Map, mutated everywhere
Before changing anything, I looked at what patching the old code would take.
Call state was just a shared Map, mutated wherever a handler needed to;
identity was tied to socket.id instead of the user, so a reconnect looked
like a new call; renegotiation worked by discarding the session and rebuilding
it. Different symptoms, same cause: there was no real state machine, so each
handler tracked call state in its own ad-hoc way, and fixing one meant touching
the others. Instead of patching handler by handler, I pulled the logic into a
single module built around an explicit FSM.
The state machine
IDLE → OFFERING → CONNECTED ↔ RENEGOTIATING → AWAITING_REJOIN → OFFERING → CONNECTED → ENDED.
Identity is the userId, not socket.id, so a dropped peer that reconnects
with a fresh socket resumes its seat instead of being treated as a new party.
That’s the AWAITING_REJOIN → OFFERING loop: same session, new socket.
This is the direct fix for the socket.id-as-identity problem above: a
reconnect no longer looks like a new call. Renegotiation (“turn my camera on”)
is a same-session transition, not a teardown.
Symmetric renegotiation
Either peer can initiate renegotiation now: turning on your camera mid-call shouldn’t need the other side to have started the call. The previous implementation only let the original offerer do it. The trade-off is glare: both sides sending an offer at the same moment. The FSM resolves it with a userId tiebreaker: the lower userId takes priority. Which side that is doesn’t matter; what matters is that both sides reach the same answer from data they already have, so no extra round trip is needed:
if (
	current === CallState.RENEGOTIATING &&
	this.session.renegotiatingUserId !== renegotiatingUserId
) {
	if (renegotiatingUserId > this.session.renegotiatingUserId) {
		throw new Error("Renegotiation in progress, retry later");
	}
}
Testing this exact glare case surfaced a real bug: a guard clause in front of
the tiebreaker (state !== CONNECTED) threw before the FSM code above ever
ran, so both simultaneous offers were rejected and the tiebreaker never got to
pick a side. The tiebreaker itself was correct; it just wasn’t reachable.
The test that caught it:
it("glare: second simultaneous renegotiation is rejected from RENEGOTIATING state", async () => {
	// Which emit the server processes first is nondeterministic, so wait for
	// both possible outcomes (relayed / error) and assert on whichever occurred.
	const relayed = [offerer, answerer].map((s) =>
		s
			.waitFor("call-renegotiate-offer")
			.then(() => true)
			.catch(() => false),
	);
	const errored = [offerer, answerer].map((s) =>
		s
			.waitFor("error")
			.then(() => true)
			.catch(() => false),
	);

	offerer.emit("call-renegotiate-offer", {
		conversationId,
		offer: RENEG_OFFER,
	});
	answerer.emit("call-renegotiate-offer", {
		conversationId,
		offer: RENEG_OFFER,
	});

	// one side relays, the other gets an error; never both, never neither
});
What helped later
Two things from this rewrite made scale-out easier, though neither was built with that in mind:
SessionStoreinterface (get/set/delete/exists/all, alreadyasync), so the in-processMapcould later be swapped for Redis with the handlers untouched.broadcastToUser/broadcastToConversationon the signaling adapter, implemented assocketServer.to(room).emit(), so registering@socket.io/redis-adapteron theServermade.to(room)fan out across instances with no adapter-code change.
The module’s interfaces are written as types anyway, even without a TypeScript build step, just to keep the contract clear:
export interface SessionStore {
	get(conversationId: string): Promise<WebRtcSession | null>;
	set(conversationId: string, session: WebRtcSession): Promise<void>;
	delete(conversationId: string): Promise<void>;
	exists(conversationId: string): Promise<boolean>;
	all(): Promise<Map<string, WebRtcSession>>;
}
Testing
53 socket-level lifecycle and edge-case specs (glare, rejoin mid-renegotiation, ICE-after-end, cross-instance teardown, and more), plus a manual 2-browser pass. No regression, and a single-instance re-run of the new protocol tracked the old baseline closely, slightly better past 150 concurrent. At single-instance scale, the rewrite is a clean swap; the real before/after only shows up under scale-out.
Scaling horizontally
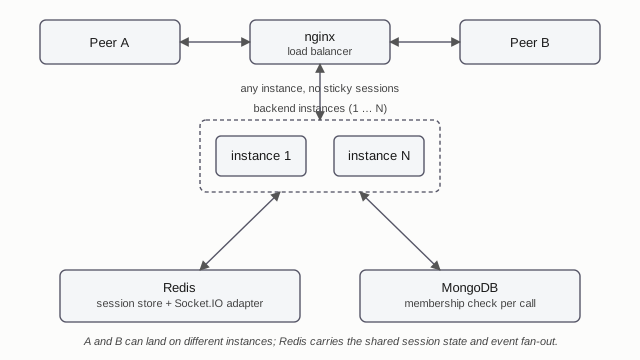
Cross-instance correctness
Two backends behind an nginx load balancer (default round-robin), no sticky sessions (the two peers in a call can land on either backend), and Redis serving both the session store and the Socket.IO adapter.
The scaling numbers only mean something if one case works first: a call between two peers who land on different backends. A plain script connects one peer to instance A and the other to instance B, then checks that a message from one reaches the other across that boundary:
await check(
	"offer → answer → ICE route across the two instances",
	async (ctx) => {
		await establish(ctx); // offerer connects to A, answerer connects to B
		const iceAtB = ctx.answerer.waitFor("ice-candidate");
		ctx.offerer.emit("ice-candidate", {
			conversationId: ctx.conversationId,
			iceCandidate: CANDIDATE,
		});
		assert.equal((await iceAtB).candidate, "x"); // proves it crossed the boundary, not just looped locally
	},
);
Offer, answer, and ICE all relay correctly between the peer at A and the peer at B; a rejoin from A notifies the live peer at B; ending the call from A shuts it down for B too.
What Redis didn’t solve automatically
Moving SessionStore to Redis was mechanical: replace the implementation, keep
the interface. Three behaviours weren’t covered by that change and needed
deliberate work of their own:
handleDisconnectdidsessionStore.all()on every socket disconnect to find which call this socket owned: aMapcopy in memory, aSCAN+MGETof every active call in the cluster against Redis. Fixed with a secondary indexsock:<socketId> → conversationId, making disconnect O(1).The session reaper ran per-instance. A background sweep (every 15 s) drops any call stuck in
AWAITING_REJOINpast a 60 s TTL and notifies whoever’s left. With N instances that became N reapers all scanning, all deleting the same stale sessions, all emittingcall-endedredundantly. Fixed with a Redis lock that only one instance can hold at a time:async acquireReaperTick(intervalMs) { const ok = await this.redis.set( 'reaper:lock', process.pid, 'PX', intervalMs - 1000, 'NX' ); return ok === 'OK'; // whoever gets the lock reaps this tick, everyone else skips it }
NX and PX are Redis’s own SET command options, not custom flags: NX
means “set this key only if it doesn’t already exist”: the first instance to
call it gets the tick, every other instance’s call just fails. PX gives the
lock a lifetime just under the tick interval, so a crashed holder doesn’t block
the next tick.
- Whether a peer was still connected only worked locally: sockets on the current instance were visible, the other instance’s weren’t. Anywhere that drove a real decision (end the call vs. mark it recoverable) had to become cluster-aware. A few lower-stakes checks were just removed instead, since emitting to a socket that’s already gone does no harm.
The scale-out numbers
A cloud server hosts the full stack (nginx, Redis, MongoDB, and N backend instances), with the load driver pinned to its own CPU cores so it can’t interfere with the system it’s testing. It’s a single physical box, not N separate machines, but each backend instance is a fully independent process that only coordinates through Redis and MongoDB, the same way it would across real hosts. The variable under test is whether that coordination scales, not network topology.
Concurrency ceiling: 1:1 call setups held under the 500 ms target:
| backend instances | ceiling | vs. 1 instance |
|---|---|---|
| 1 | ~410 | 1.0× |
| 2 | ~670 | 1.6× |
| 3 | ~990 | 2.4× |
| 4 | > 1000 (past the sweep) | n/a |
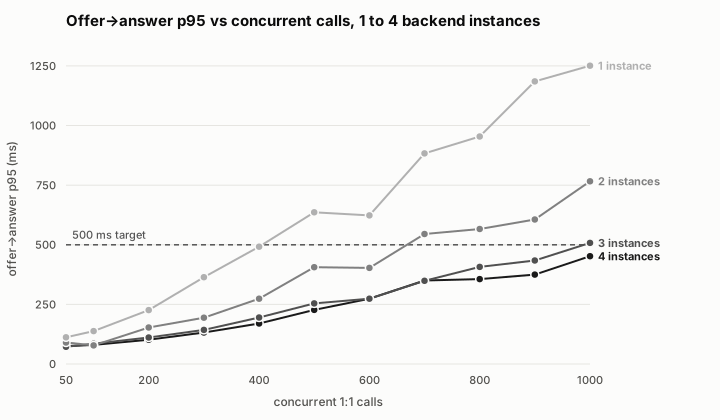
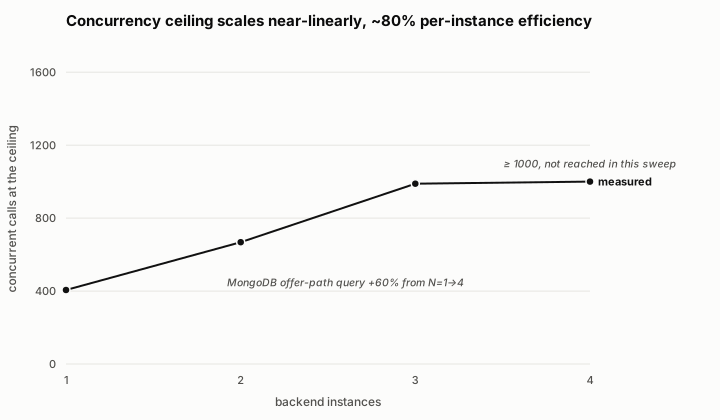
Each added instance adds 250–270 more concurrent calls, about 80% of the ~330 a perfectly isolated instance would add. The missing 20% traces back to the database they all share: the single membership check every call setup makes against MongoDB gets slower as more instances hit it at once (3.8 to 6.1 ms on average, from 1 instance to 4). By 3 and 4 instances, that’s clearly the next limit.
What’s next
- MongoDB is the next bottleneck: one membership lookup per
call-offer, one replica set, shared across every instance. Scaling past ~4 instances means scaling the DB too: serve those reads from replica-set secondaries, or cache the membership check so most offers skip the query. - A hard crash, not a graceful shutdown, leaves a zombie session. If a
backend process is killed mid-call, the surviving peer never gets a
disconnect and can’t rejoin, because the handler that does both was on that
instance. The reaper only sweeps
AWAITING_REJOINsessions, so it misses this one too; the session’s 6-hour TTL is the only thing that eventually clears it. Detecting that a peer’s whole instance is gone, not just its socket, is still unbuilt.